Performance Highlight
We uphold the mission of “Continuously Creating Time-Giving Software” and provide value in the form of time through our own products that cater to the needs of the era.
The fiscal year ending February 2024 marks the final year of our medium-term management plan, “SDGs Mind 2021,” and the
first year of our “New Two-Year Management Plan.” In the “New Two-Year Management Plan,” we have restructured the five key initiatives set forth in “SDGs Mind 2021” and introduced four new key initiatives. The IT industry is experiencing a tailwind driven by the promotion of DX (digital transformation). In such an environment, we have consistently adopted the latest technologies
and enhanced our competitiveness by providing services that tailored to our customers’ needs. Going forward, we will continue
to leverage the latest technologies to provide the value of time to an even broader customer base.
Performance Trends since the Company’s Founding

Performance and Forecast
|
FY2020/2
|
FY2021/2
|
FY2022/2
|
FY2023/2
|
FY2024/2 (forecast) |
|
| Sales |
4,554 |
4,258 |
4,817 |
4,486 |
4,892 |
| Operating income |
661 |
416 |
587 |
406 |
371 |
| Ordinary income |
664 |
423 |
588 |
416 |
392 |
| Net income |
458 |
293 |
391 |
280 |
918 |
Net sales ・ Ordinary income

Net asset ・ Equity ratio

| Financial period |
FY2019/2 |
FY2020/2 |
FY2021/2 |
FY2022/2 |
FY2023/2 |
|---|---|---|---|---|---|
|
Net asset (mil. yen) |
2,031 |
2,264 |
2,431 |
2,714 |
2,869 |
|
Equity ratio (%) |
73.4 |
68.9 |
69.5 |
75.8 |
75.9 |
Net assets per share・Net income per share

| Financial period |
FY2019/2 |
FY2020/2 |
FY2021/2 |
FY2022/2 |
FY2023/2 |
|---|---|---|---|---|---|
|
Net income per share |
52.26 |
41.62 |
26.62 |
35.50 |
25.62 |
|
Net assets per share |
183.39 |
205.70 |
220.88 |
246.38 |
262.81 |
ROE・ ROA

| Financial period |
FY2019/2 |
FY2020/2 |
FY2021/2 |
FY2022/2 |
FY2023/2 |
|---|---|---|---|---|---|
|
Return on equity (ROE) |
32.2% |
21.3% |
12.5% |
15.2% |
10.0% |
|
Return on assets (ROA) |
18.7% |
22.0% |
12.5% |
16.6% |
11.3% |
Performance on Business Segment
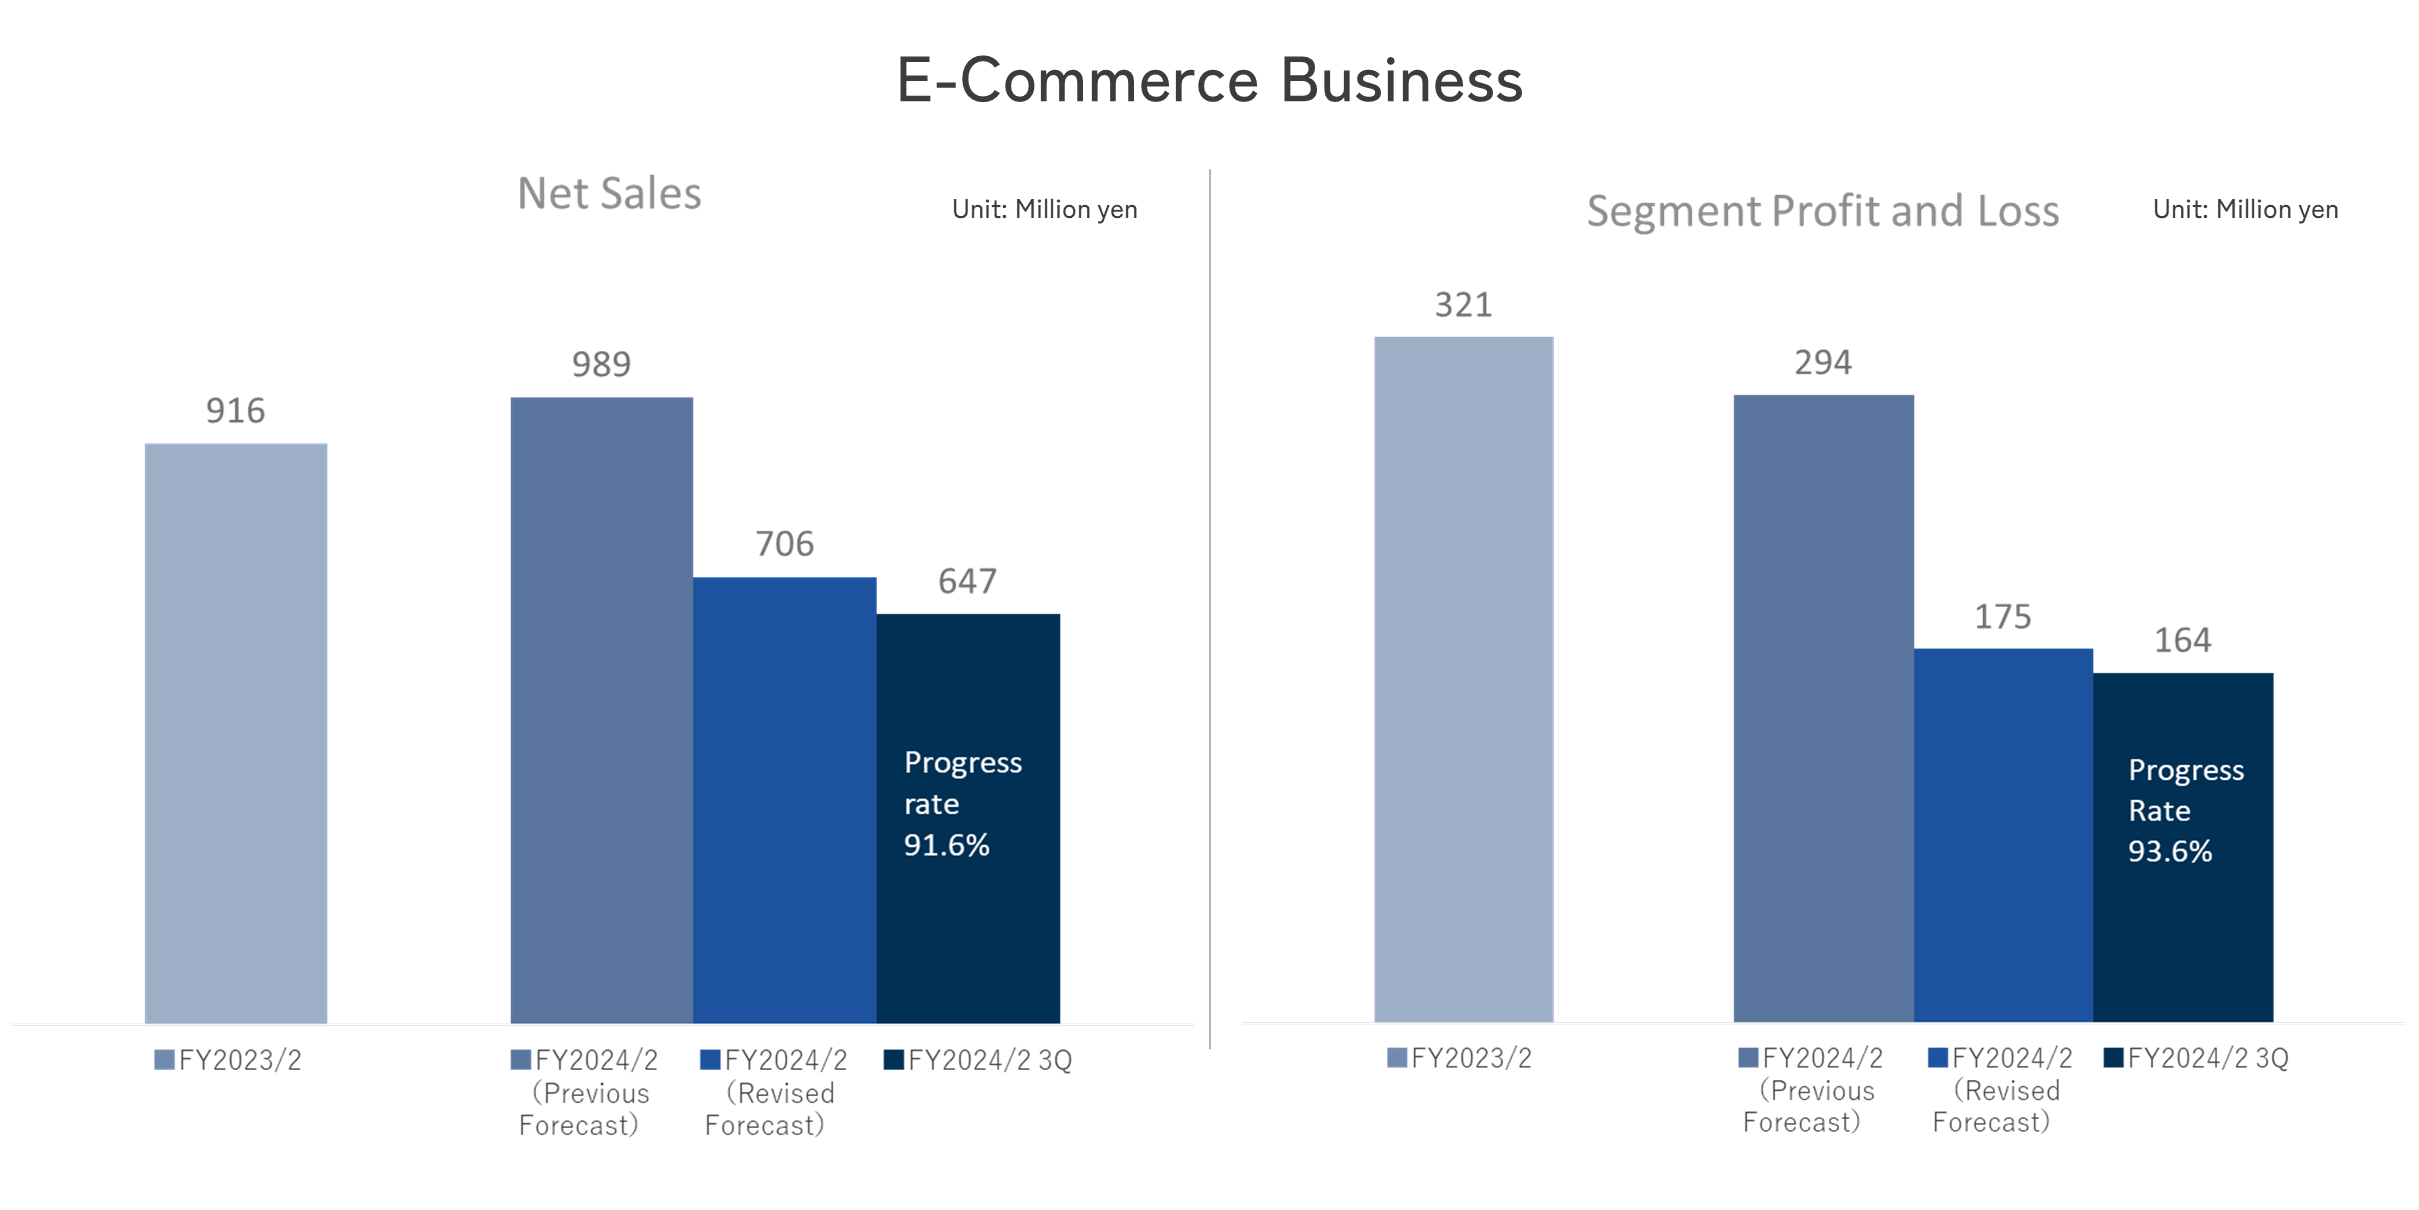
E-Commerce Business
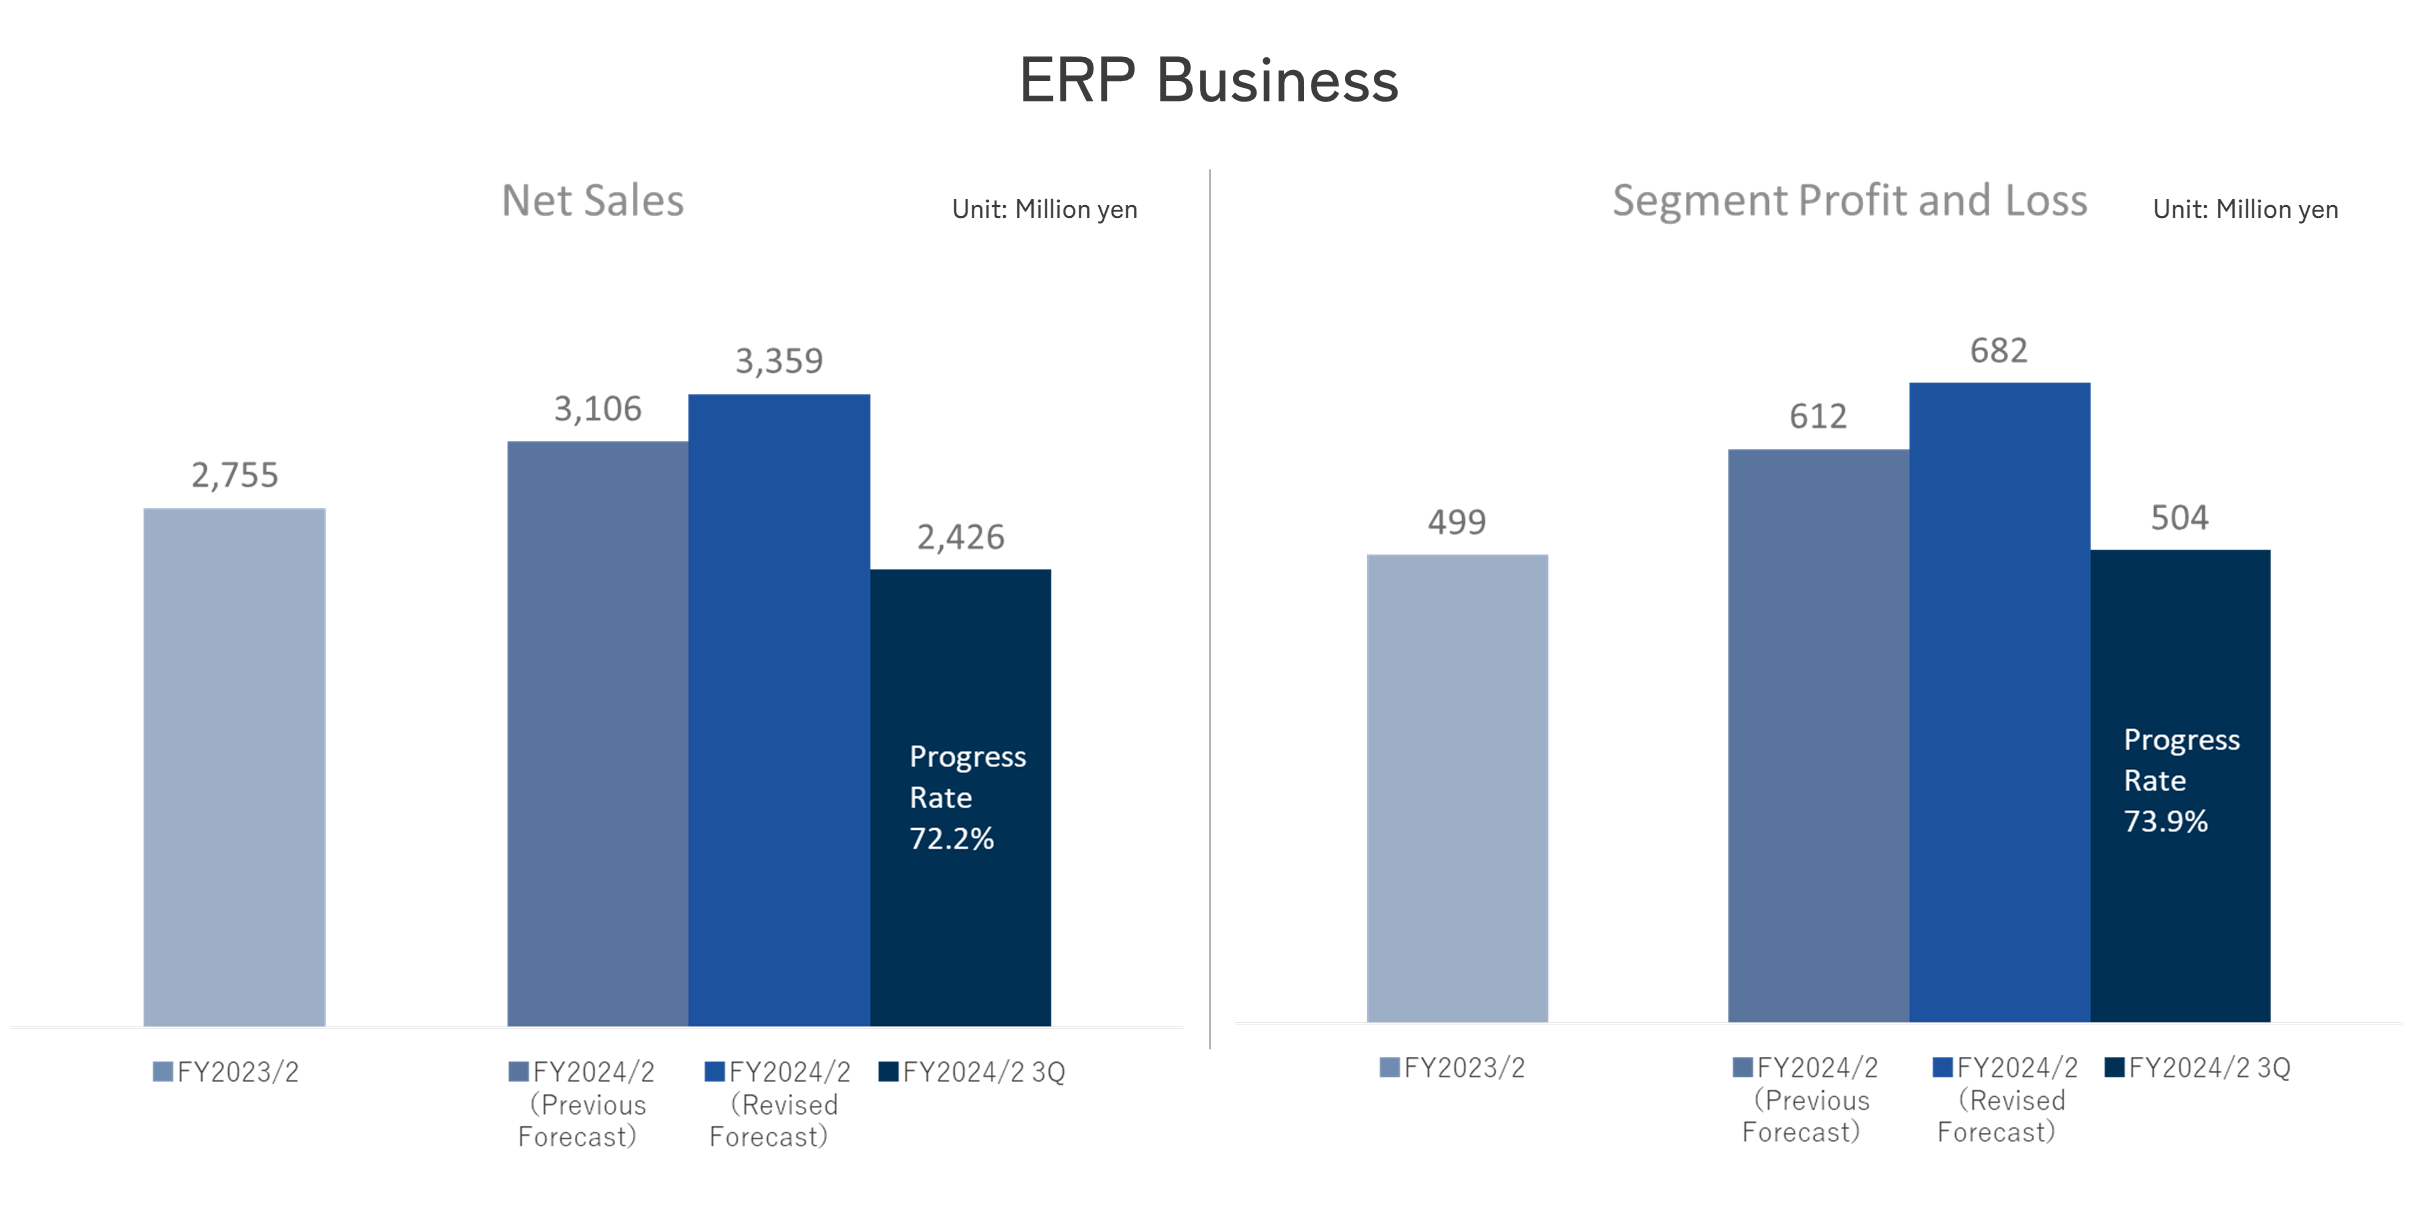
ERP Business
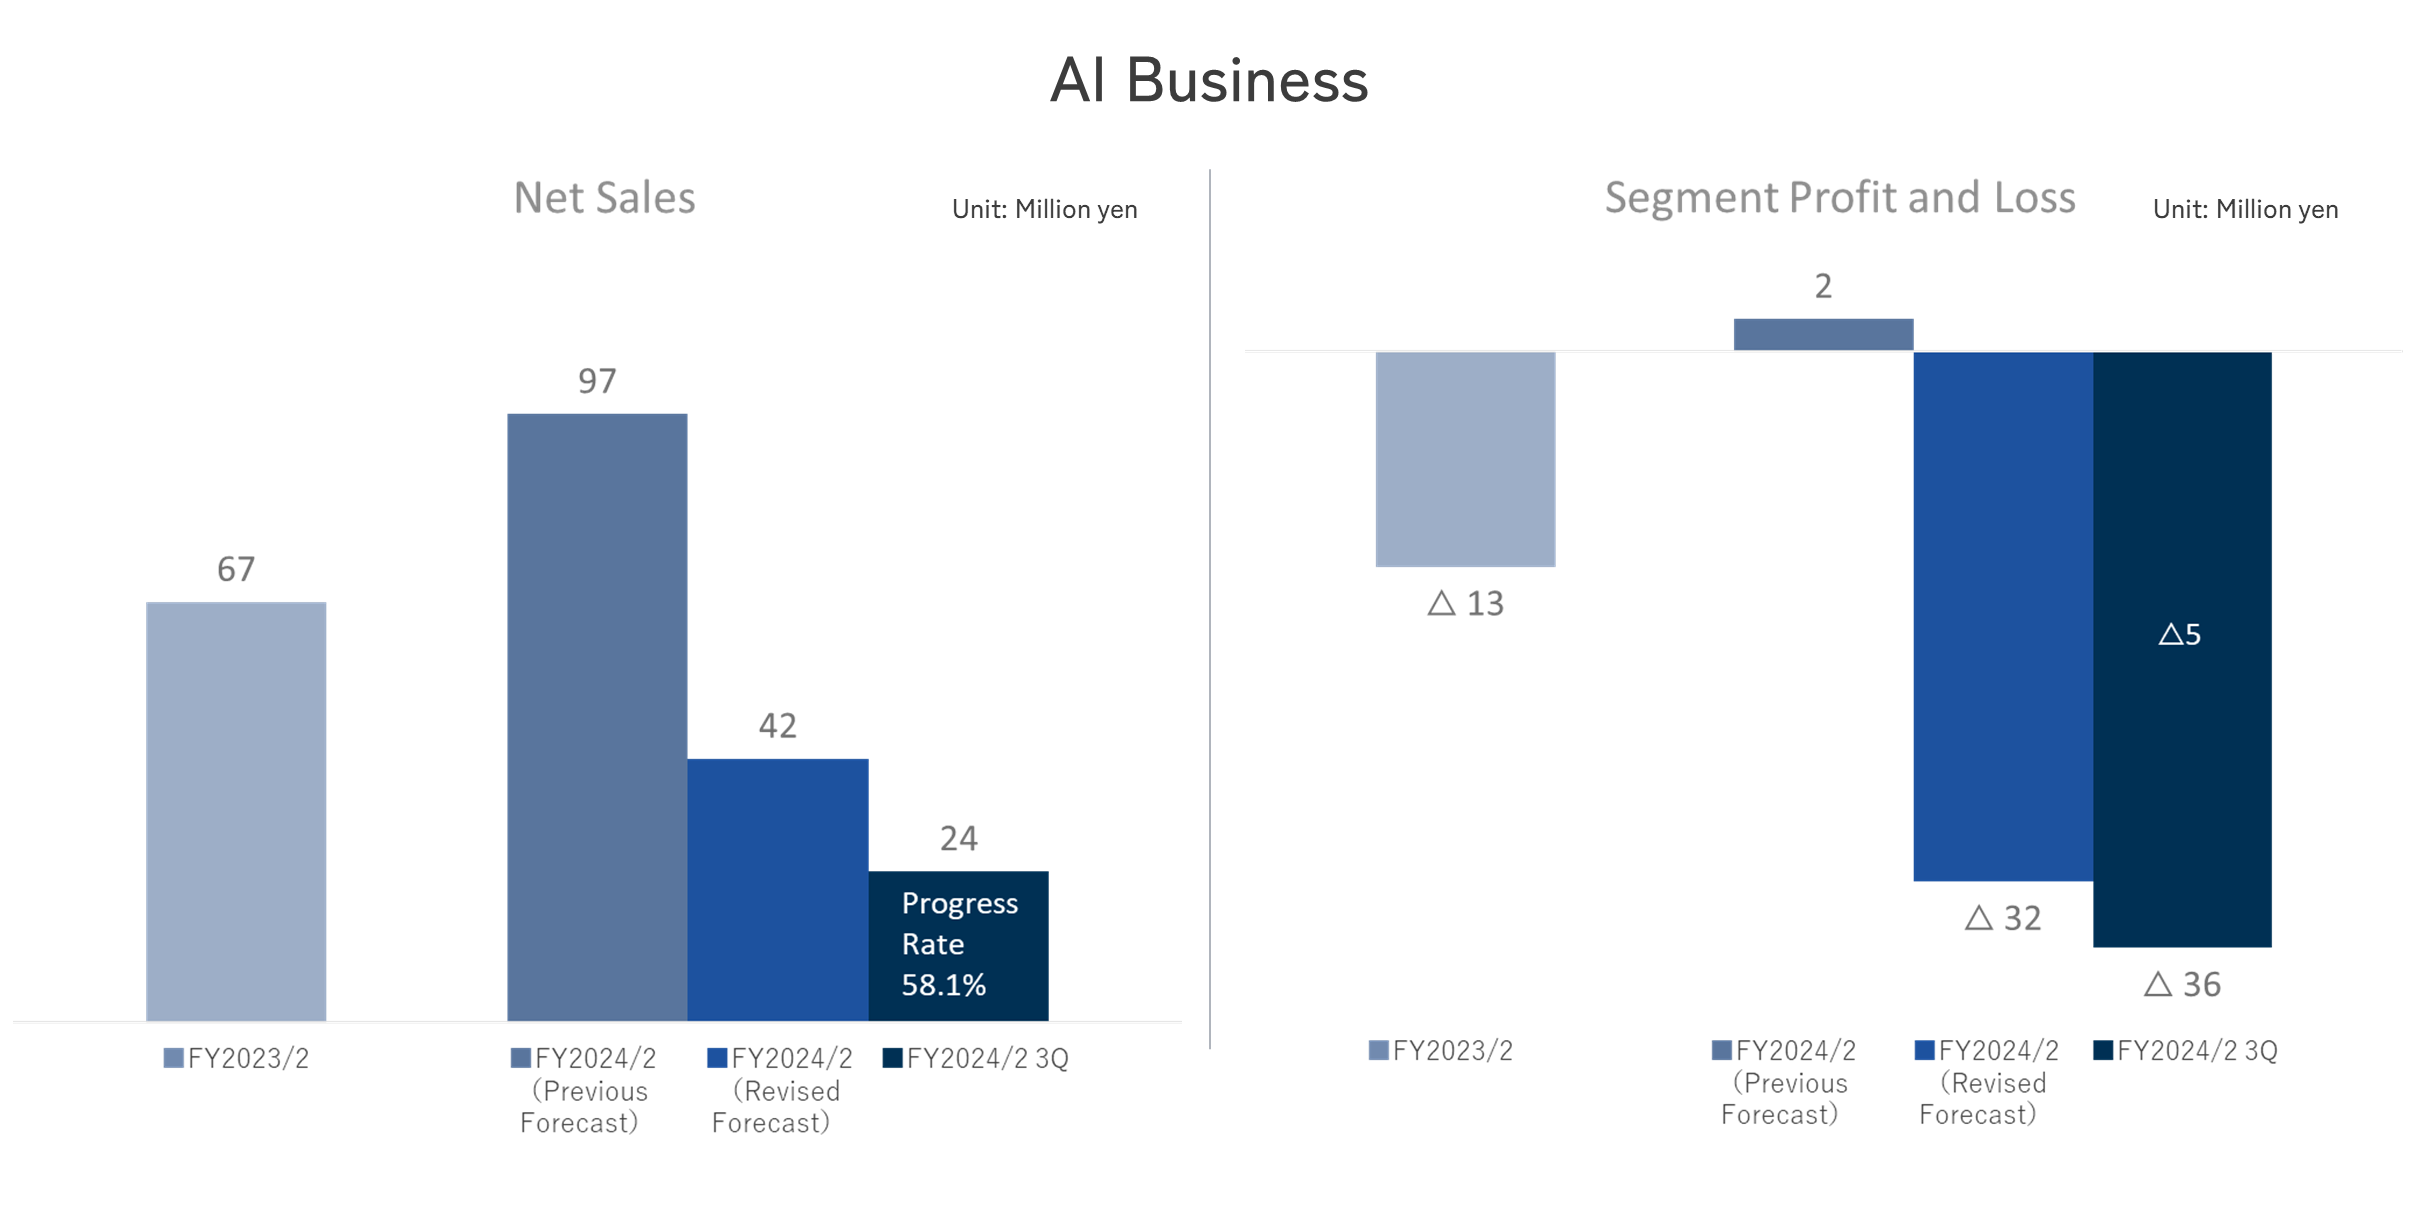
AI Business
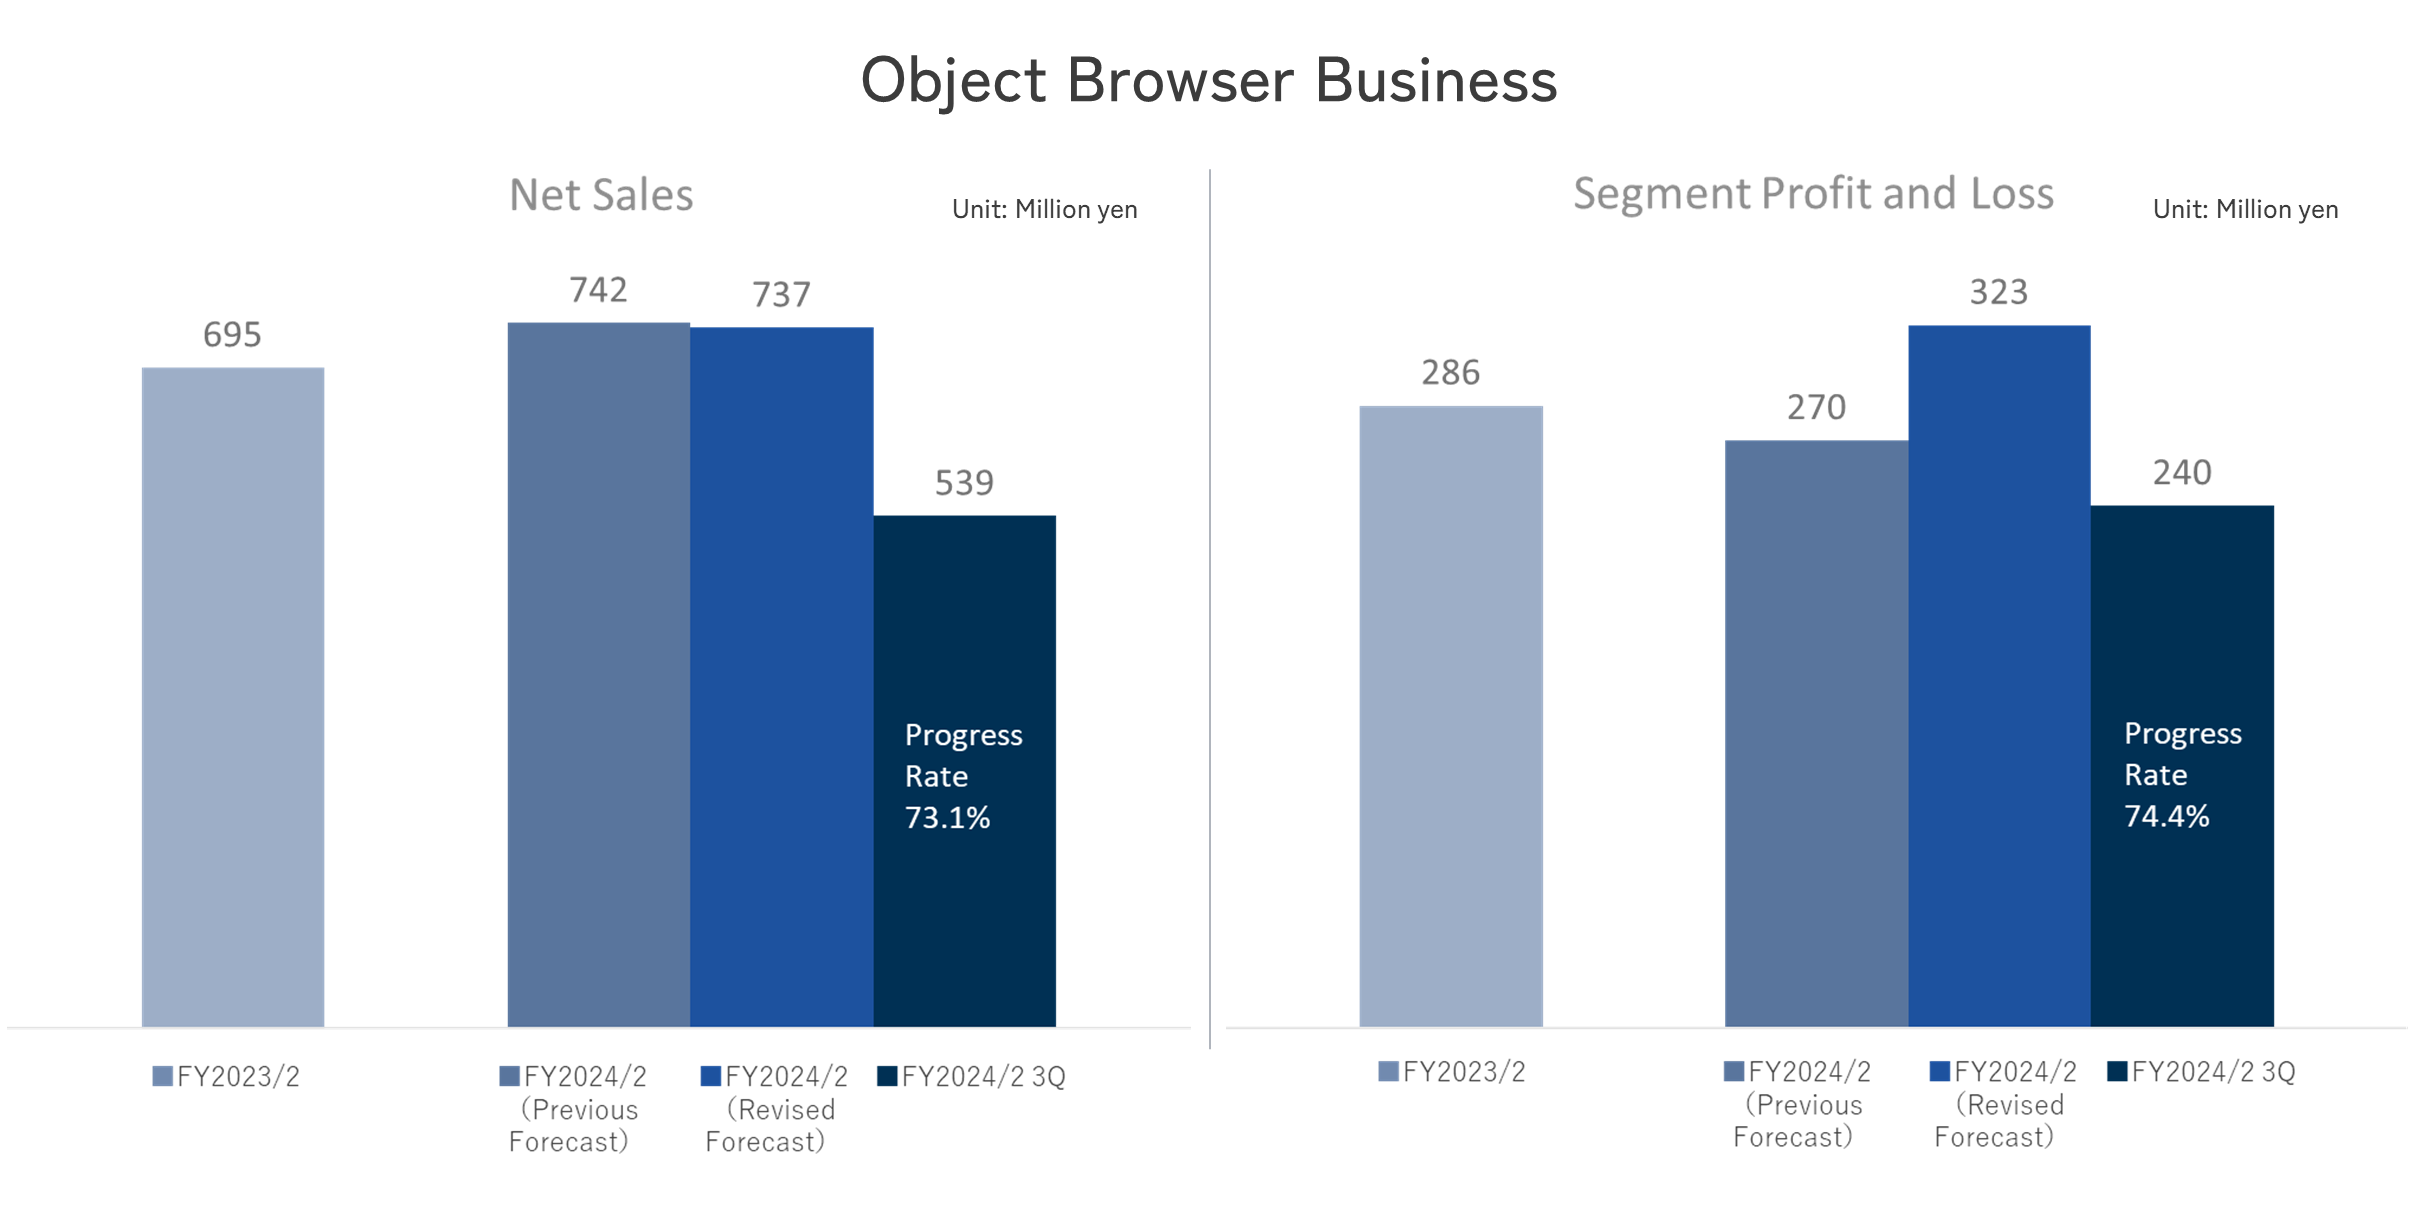
Object Browser Business
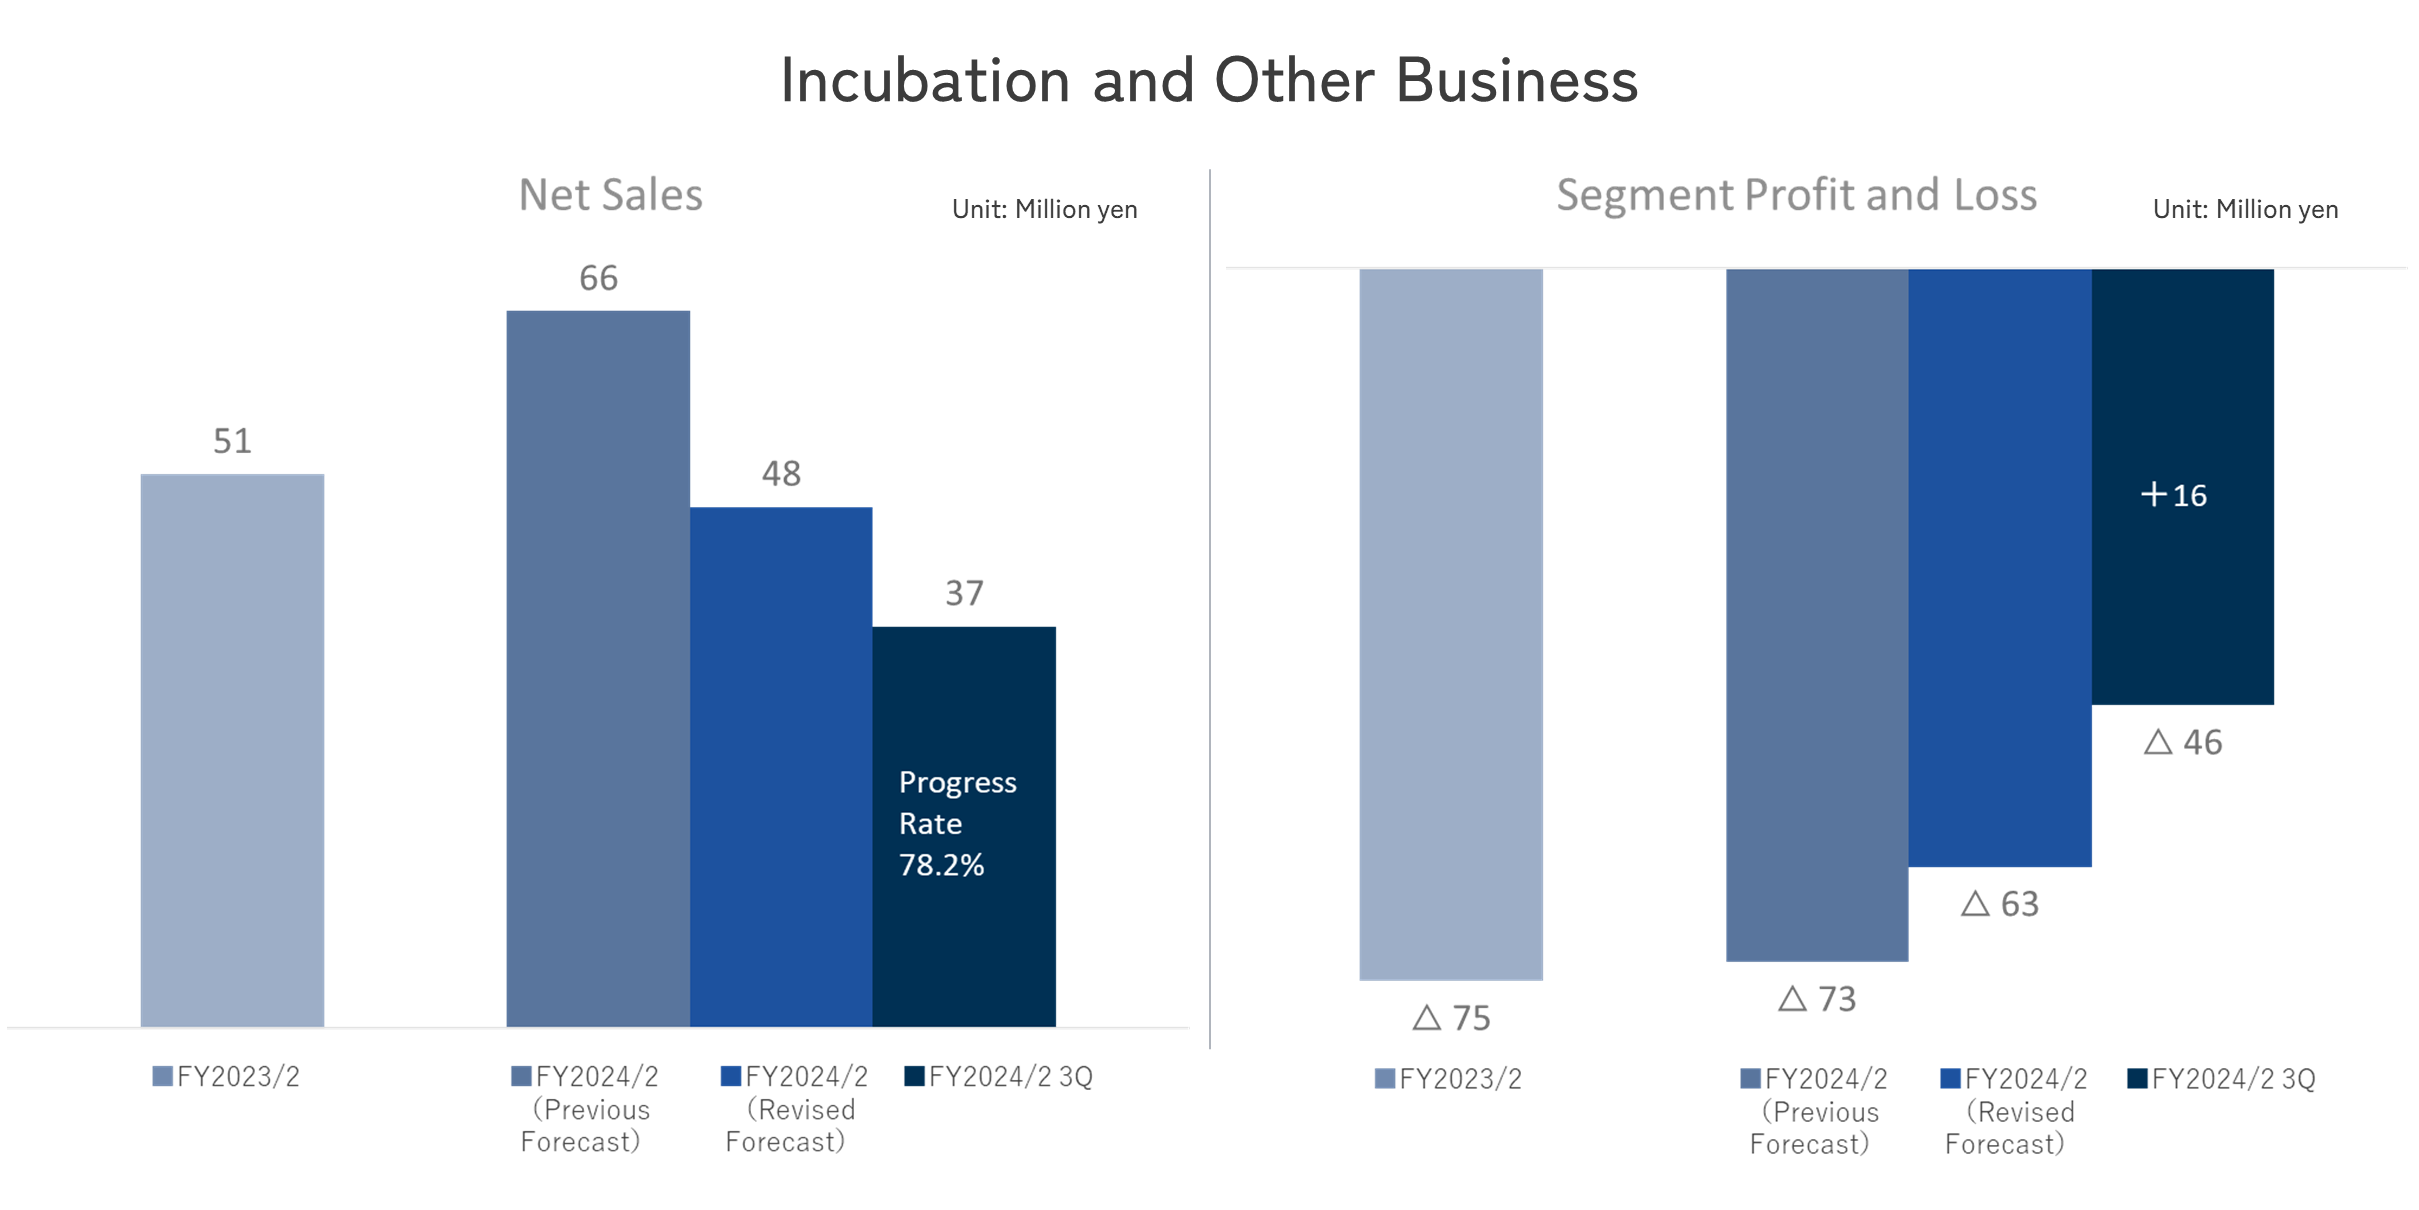
Incubation and Other Business
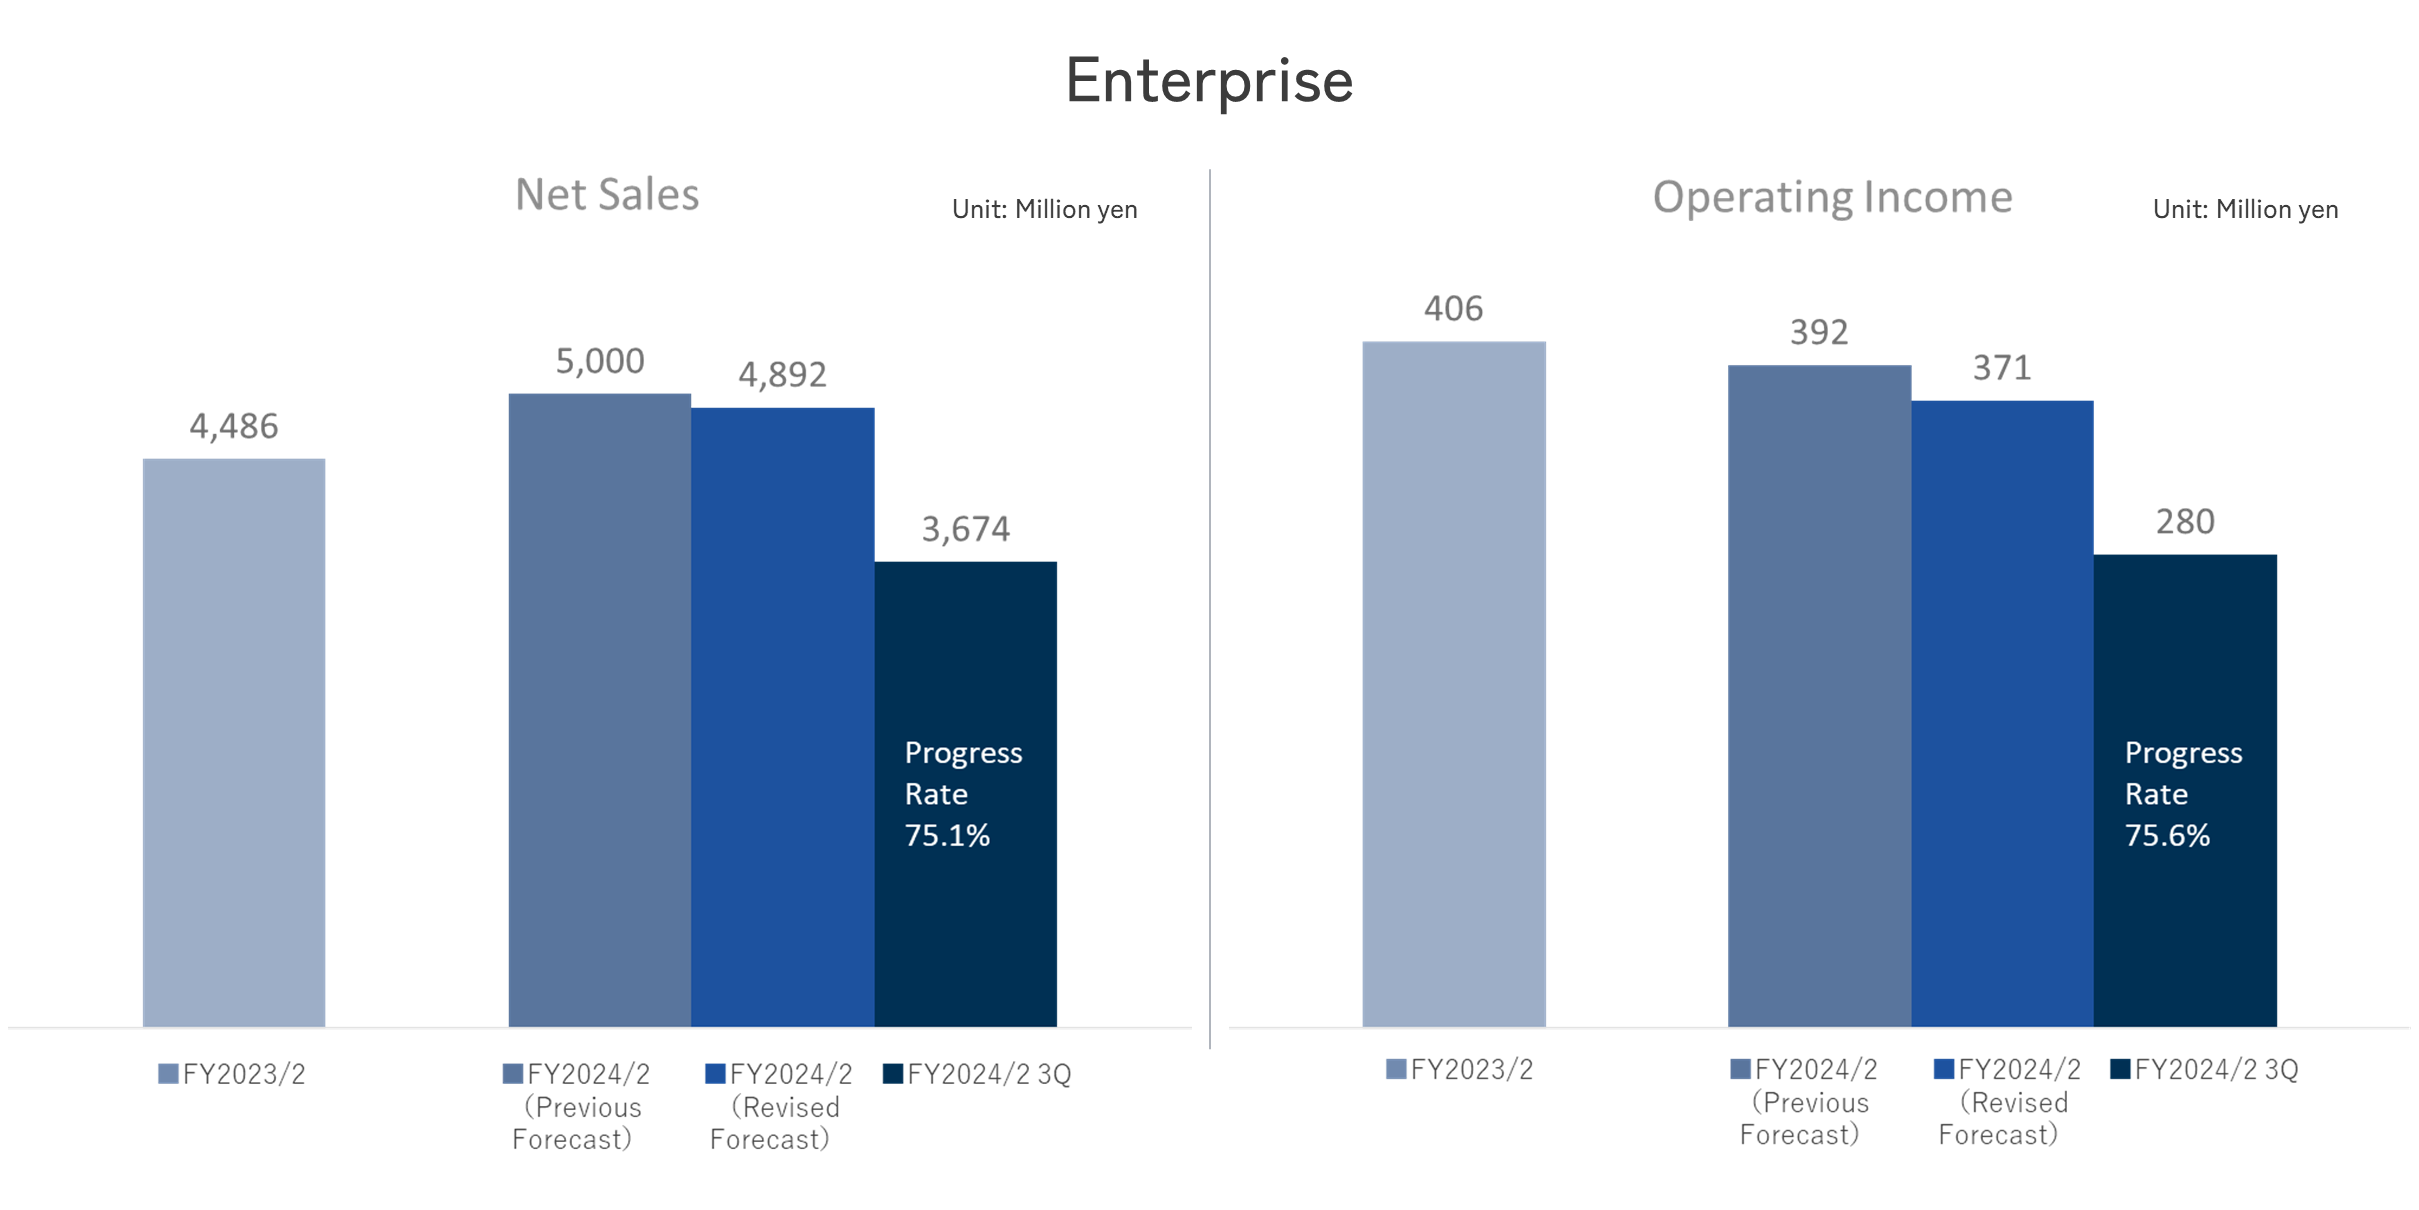
Enterprise
E-Commerce Business
ERP Business
AI Business
Object Browser Business
Incubation and Other Business
Enterprise
For more information, please see the Fact Book.
For more information, please see the Fact Book.
-
Management Policy
-
Stock Information